Appendix A. Root Cause Analysis/Corrective Action Process Summary
A defect is a type of nonconformity that occurs when a product or service fails to meet specified requirements. A defect is an error or mistake that must be corrected. QC requirements and inspections should be designed to detect defects in processes or products. Once a defect is detected, a Root Cause Analysis/Corrective Action process is implemented to identify the cause of the defect and an appropriate correction to eliminate the defect.
The American Society for Quality (ASQ) defines a root cause as “a factor that caused a nonconformance and should be permanently eliminated through process improvement,” and RCA as “a collective term that describes a wide range of approaches, tools and techniques used to uncover causes of problems.”
A common approach to RCA is the “5 Whys”. This technique is used in the Analyze phase of Six Sigma DMAIC (Define, Measure, Analyze, Improve, Control) methodology and is recommended in many other RCA techniques. By repeatedly asking ‘Why?’ (five times is rule of thumb), layers of symptoms are explored, which can lead to the root cause of a problem. The 5 Whys questions:
- help identify the root cause of a problem;
- help determine the relationships between different root causes of a problem; and
- are one of the simplest tools to use and are easy to complete without statistical analysis.
The 5 Whys tool is most useful when problems involve human factors or interactions, such as in geophysical data collection. This process can be used in day to day business, within or without a Six Sigma project.
The following steps and examples (in italics) outline how to complete a 5 Whys analysis:
- Write down the specific problem. Writing helps to formalize the problem and describe it completely. Writing the problem down also helps a team focus on the same problem. (The geophysical mapping team failed to select a blind seed as a target for excavation.)
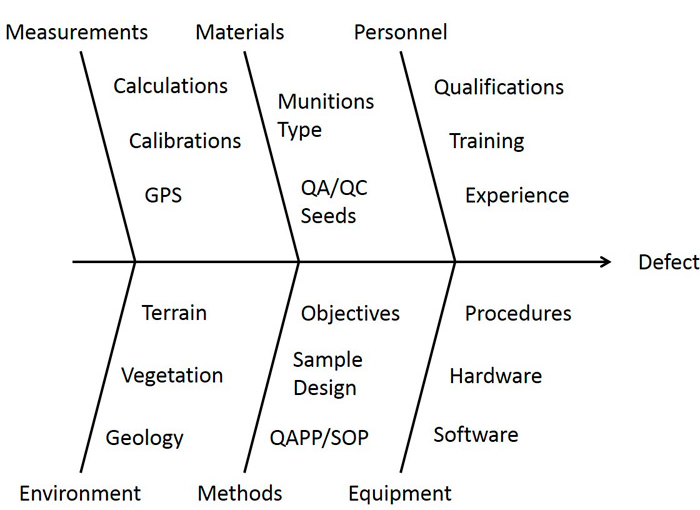
- Ask why the problem happens and write the answer down below the problem. An Ishikawa Diagram (fishbone) is helpful in diagramming the 5 Whys process; see Figure 9-14. (Geophysical sensor did not pass over the blind seed. Geophysical equipment was not functioning properly. Data were not processed correctly. Blind seed was buried incorrectly, for example, too deep or masked by another metallic object.).
- If the answer does not identify the root cause of the problem identified in Step 1, ask “Why?” again and write down that answer.
- Loop back to Step 3 until the team agrees that the problem’s root cause is identified. This process may take more or fewer times than five iterations. For nonconformances like the example, where multiple causes are identified, each should be questioned and eliminated as the root cause. This is where an Ishikawa Diagram is most helpful.
Using an Ishikawa Diagram
The following steps are helpful when using the Ishikawa (fishbone) Diagram with the 5 Whys tool:
- Agree on the problem statement – spend some time identifying the problem specifically. Write the problem statement at the mouth of the fish. Avoid defining the problem in terms of a solution (e.g., we need more of something).
- Agree on the major categories of causes of the problem – these are written as branches from the main arrow. Major categories include: equipment or supply factors, environmental factors, rules/policy/procedure factors, and people/staffing factors.
- Brainstorm all the possible causes of the problem – ask ‘Why does this happen?’. Assign each causal factor as a branch from the appropriate category. Causes may be relevant to more than one category.
- Ask again about each cause and develop subcauses.
- Continue to ask Why about each subcause and generate deeper levels of causes and continue organizing them under related causes and categories until the team identifies and addresses a genuine root cause.
A step beyond the 5 Whys analysis is the 5 So What analysis. The 5 Whys tool is useful to identify the relationship between the causes and the actual problem. For the example: the cause of the missed seed was that the seed was placed in an area where the seed signature was masked by a nearby metal mass. It was placed there because the seed placement team inadvertently failed to check the placement site with a metal detector before burying the item. They did this because they were in a hurry to meet production quotas and did not follow their SOP.
The So What analysis is useful to identify prioritizing potential solutions or corrective actions. By asking So What in response to the impact of a potential solution, the team will reach maximum impact. The impact of different solutions can be compared to assist in prioritizing the solutions that provide the best support to customer requirements or project goals.
For the example: Possible Solutions: 1) Retrain the seed placement team. So What? They could still violate the SOP. 2) Assign new people to the seed placement team. So What? They could still violate the SOP. 3) Allow more time for seed placement. So What? They could still violate the SOP. 4) Allow more time, retrain the seed placement team and increase the oversight on the team including independent checks of the seeds after placement. So What? Any violation of the SOP (or other improper placement of seeds) would be detected before geophysical data were collected. Although a nonconformance in seed placement might occur, this should adequately address the initial nonconformance of missing a seed in the geophysical data.

Figure 9‑14. Example Ishikawa (fishbone) diagram


