9 Case Studies
This chapter presents two case studies at former MR installations. These case studies provide examples of project specific quality considerations, lessons learned, and successes.
9.1 Case Study 1: AGC Lessons Learned at the former Camp San Luis Obispo
This case study presents lessons learned using AGC on a recent treatability study conducted at the former Camp San Luis Obispo. The purpose of this study was to remediate a 7-acre site using AGC. Quality topics presented include the initial planning process, QC reporting, application of Informed Source Selection (ISS) to reduce the number of targets requiring cued measurements, and some of the QC successes encountered during this project.
9.1.1 Background
The former Camp San Luis Obispo (CSLO), occupied approximately 14,959 acres in San Luis Obispo County. The site is located along California State Highway 1, approximately 8 miles east of the Pacific Ocean (at Morro Bay) and approximately 5 miles southwest of U.S. Highway 101, as shown in Figure 9‑1. The treatability study was performed within 7 acres in the southern portion of Munitions Response Site 05 (MRS-05). The MRS-05 Range Complex consists of approximately 2,523 investigation acres situated north of Highway 1 and spanning the width of the entire former training area, with all ranges facing north to northeast. The following types of munitions are suspected or known to have been used in MRS-05:
- Projectile, 105mm High Explosive (HE)
- Projectile, 105mm Smoke
- Projectile, 75mm Shrapnel
- Projectile, 37mm HE
- Rocket, 5in HE
- Rocket, 2.36in High Explosive Anti-Tank (HEAT)
- Rocket, 2.36in Practice
- Mortar, 81mm HE
- Mortar, 81mm white phosphorus (WP)
- Mortar, 60mm HE
The 7-acre treatability study site was selected because it is representative of the challenging terrain and conditions that are present throughout other munitions-contaminated areas at CSLO. Prior to the treatability study, wide-area geophysical transect surveys were performed across several proposed investigation areas. This site was determined to have a good distribution of high and low anomaly density areas, which offered the opportunity to effectively test the AGC process on a wide range of anomaly density scenarios.
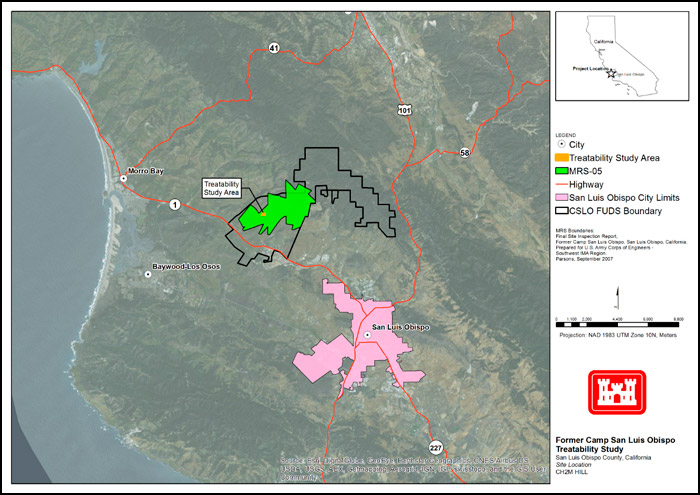
Figure 9‑1. SLO Site Location Map. The 7-acre treatability study area (orange shading) is situated within the 2,523-acre MRS-05 (green shading) at the former Camp San Luis Obispo.
The project entailed a dynamic detection survey across the entire 7-acre site using a TEMTADS 2×2 sensor array followed by a cued classification survey on selected anomalies using the same instrument. The TEMTADS 2×2 is the prototype sensor developed by the Naval Research Laboratory that the commercially available MetalMapper 2×2, produced by Geometrics Limited, is based upon.
Based upon the CSM, 37mm projectiles were determined to be the smallest TOI at the site. The ISS process (described in more detail below) was used to reduce over 16,000 amplitude response selections to 6,400 targets requiring further investigation during the cued classification survey. These 6,400 targets were investigated with static measurements and by applying AGC; a total of 575 intrusive investigations were required to recover 169 TOI: 165 seed items, 3 pieces of MD that had retained their original shape, and 1 MEC (37mm projectile).
9.1.1.1 Initial Planning Quality Considerations
The planning process began with preparation of the UFP-QAPP in which DQOs were established using the USEPA’s 7-step process. The specific DQOs are documented in Worksheet #11 of the UFP-QAPP. The detection/classification objective of the project was to detect and classify munitions equivalent to a 37mm projectile at a depth of 30 cm. This objective requires that munitions larger than 37mm projectiles be detected to the depth at which they would provide the same response amplitude as the 37mm projectile at 30 cm. The vertical CSM shown in Figure 9‑2 shows the maximum reliable depth of detection for the munitions anticipated to be present at the site. In this figure, blue lines represent conventional amplitude response detection depths and red lines represent detection depths using ISS. Red stars indicate the deepest depth for actual TOI recovered from the site. The maximum reliable depth of detection is based on the munition being at the least optimal position and orientation under the sensor. Munitions with more optimal positions and orientations are detected at greater depths.
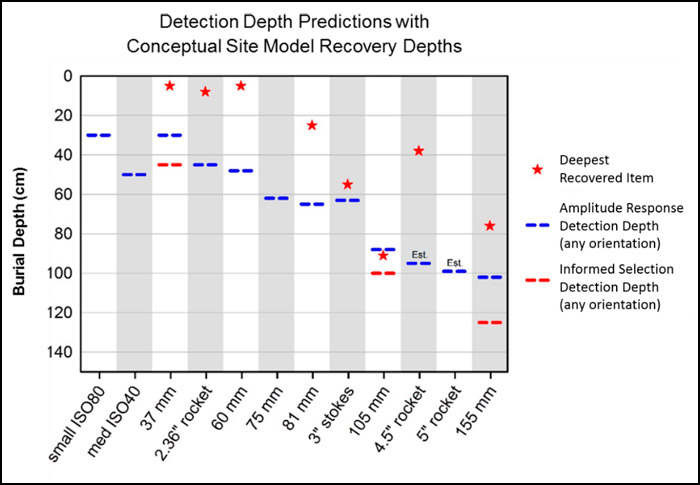
Figure 9‑2.VCSM. Maximum reliable depths of detection for munitions identified in the CSM.
Project-specific MPC were developed for both the detection survey and the classification survey.
Detection Survey
The MPCs and associated DQIs for the detection survey addressed coverage, detection (including precise positioning) of IVS and blind seeds, and delivery of the data and target lists. The specific MPCs are documented in Worksheet #12 of the UFP-QAPP. The detection threshold was determined using the modeled, worst case orientation/position response for a 37mm projectile and the anticipated sensor noise levels were assessed to ensure a minimum SNR of 5. The noise levels, calculated as the standard deviation of the signal in nonanomalous regions, were confirmed during the initial IVS survey to be low enough to support the survey objectives.
Figure 9‑3 presents the modeled worst-case response as a function of depth. In this figure, the solid line presents the modeled TEMTADS 2×2 response to a 37mm projectile at its worst-case orientation and position relative to the sensor. At the detection goal depth of 30 cm, the modeled response is 1.7 mv/A (upper dashed line). The lower dashed line presents the site-specific noise resulting in a signal to noise ratio of 9.4. The project depth of investigation requirements resulted in an SNR of 10.
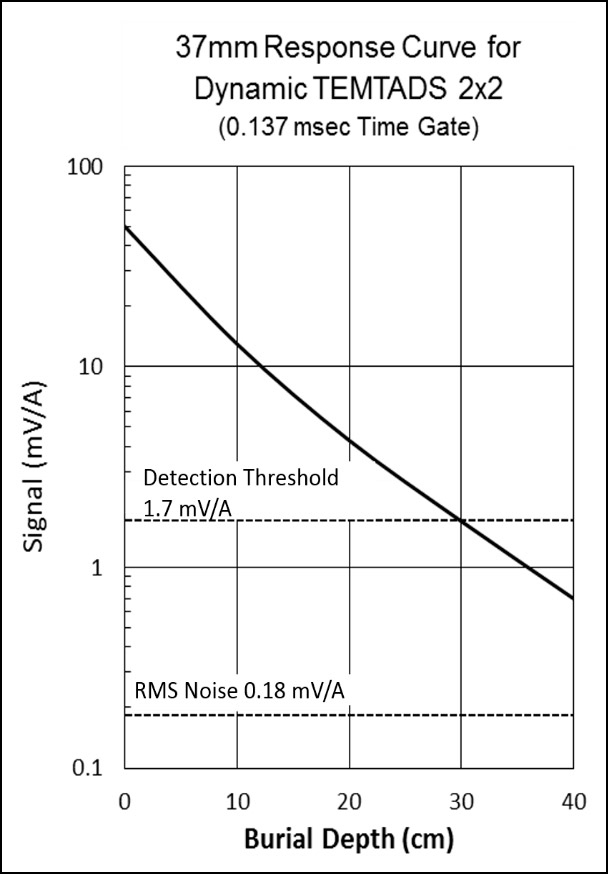
Figure 9‑3. Detection threshold.
The MPC may only be met if the operation of the system is consistent with the initial assumptions regarding system performance. To ensure that the MPCs could be met, MQOs were developed. The MQOs for positioning precision and survey coverage were more stringent than a typical DGM survey because the success of AGC depends on these aspects of the data. The specific MQOs are documented in Worksheet #22 of the UFP-QAPP. The positioning precision requirement was 0.25 m (driven by the capabilities of the advanced EMI sensor), and the specification for coverage required 100% survey coverage with no allowance for small gaps other than physical obstructions. The MQOs also included specifications for detailed sensor assembly/testing protocols, transmitter current limits, attitude data verification, sensor response limits, and a quantitative evaluation of sensor response repeatability over the IVS targets.
Classification Survey
Planning for the classification survey also resulted in a set of MPC and supporting MQOs specific to classification approach. The MPC for the classification survey addressed the items to be included in the classification library, requirements for 100% proper, and deliverable requirements. A total of 27, primarily quantitative, MQOs were developed to support the classification MPC, covering assembly, system testing, background measurements, positioning, system response, and inversion results.
9.1.2 QC Tracking for Classification
Requirements for documenting quality metrics include project level metrics (primarily MPC), daily quality testing performed before and after each day of data collection, and quality metrics for each individual measurement. Before each measurement can be used to meet the project level MPCs, it must be shown to have been collected between two sets of daily quality tests (function tests and IVS measurements) that passed their respective MQOs and several MQOs for each individual measurement. All test results must be compiled to enable reliable detection and removal of outliers as well as easy inspection to confirm that each individual measurement supports classification.
9.1.3 QC Successes and Associated Lessons Learned
Repeatability of dynamic survey response amplitude over IVS items. The MQO for repeatability of dynamic survey response amplitude over IVS items was initially ±25%, but it was discovered that the MQO was not being met even though all other aspects of the system and survey process were in accordance with QAPP specifications. Upon further analysis, it was determined that the cross-track position of the target relative to the array results in larger signal response variations than are allowed for by the MQO. Figure 9‑4 presents the peak amplitude response as a function of cross-track position of the target relative to the sensor footprint. In this figure, modeled response profiles for an object under the footprint of the sensor (-0.4 m to 0.4 m) show considerable variation in signal depending upon the cross-track position of the object. The peak responses occur directly under each coil and the minimum response occurs directly under the center of the array and under the edges of the array (-0.4 to 0.4 m). The failure to meet the original MQO did not represent a failure of the system. Because the sensor response was being verified with much greater precision using function tests (which test the response of a known object at a precisely known position relative to the sensor), it was determined that this MQO was redundant and was not required.
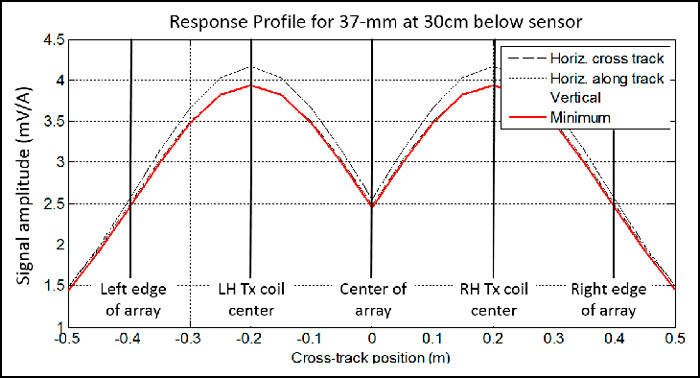
Figure 9‑4. TT response profile.
Informed Source Selection Advantages. ISS is the process by which anomaly sources are characterized using the advanced sensor data set, allowing for rejection of small or thin-walled sources as possible TOI. This process inverts the anomalous data to find intrinsic (size and wall-thickness) and extrinsic (location) feature estimates of the sources. Sources found to be too small or thin-walled to be possible TOI are removed from the target list. The ISS process presents considerable advantages over conventional amplitude response-based detection. Using AR detection, all targets with a response greater than or equal to the response for the smallest TOI at the maximum depth of reliable detection must be selected. As a result, many shallow, smaller targets as illustrated in Figure 9‑5 are also selected for further investigation. This figure shows that the amplitude response to small, shallow sources can be as large, or larger than the project detection threshold required to detect all TOI, resulting in many investigations required for sources that are too small to be TOI. The ability to reject these targets presented a 60% reduction in the number of required cued investigations.
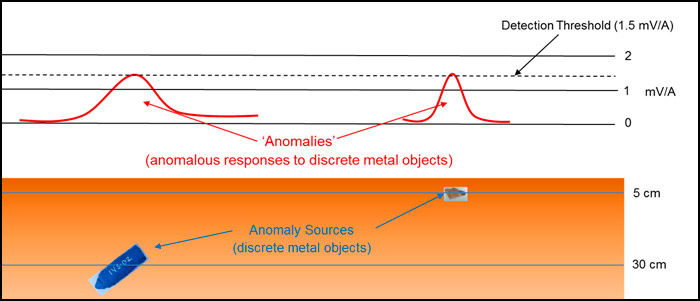
Figure 9‑5. Amplitude response detection.
In addition to the cost savings, the use of ISS also allows a greater depth of investigation. The detection threshold for conventional amplitude response detection is typically set at five times the noise to minimize the number of noise picks (no-finds). Because ISS rejects clutter and noise targets, the original detection threshold can be set with a much lower SNR, resulting in a deeper depth of investigation.
A third advantage of ISS detection is that it detects and accurately locates sources with overlapping signatures. Figure 9‑6 presents a situation where the response to a seed is masked by an adjacent signature. Amplitude response-based detection did not identify the seed as a target as it was not distinguishable from the larger adjacent source. Ordinarily, this reading would result in a QC failure; however, using ISS the two separate sources located with overlapping signatures are distinguishable from each other and are each selected for further investigation.
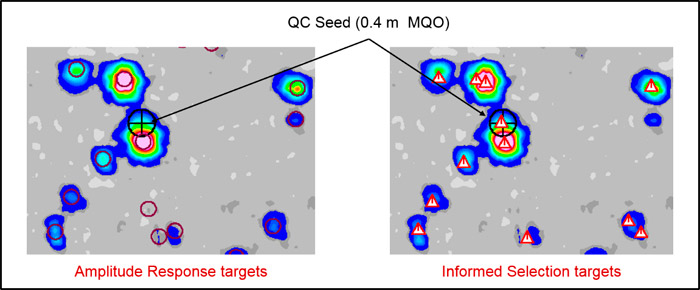
Figure 9‑6. AR vs ISS overlapping signatures. Left panel: Amplitude response detection failed to detect a seed that is masked by an overlapping signature. Right panel: ISS correctly detects the seed item.
Intrusive investigation missed QA seed. During the intrusive investigation process a QA seed was not recovered during the initial intrusive investigation. The AGC geophysicist reviews the intrusive results to confirm that the recovered item is a qualitative match to the AGC model results (illustrated in Figure 9‑7). The purpose of this comparison is to provide a line of evidence that serves to validate the AGC process; however, this comparison also serves as a QC check on the actual intrusive investigation process.
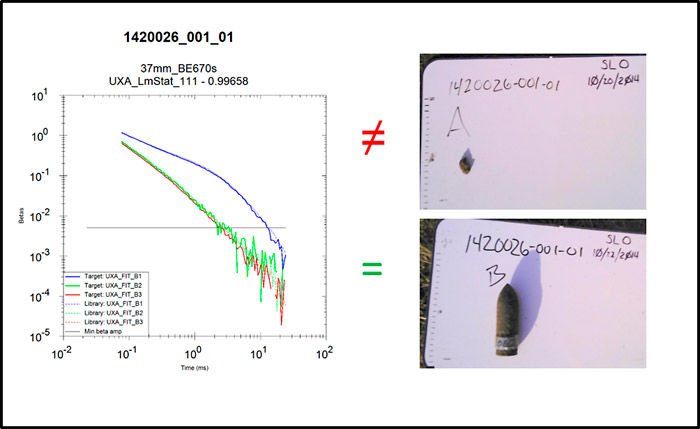
Figure 9‑7. Missed QA Seed. The initial dig result (top photo) for this location failed to recover the seed (bottom photo). The QC failure was identified by the contractor geophysicist when comparing the AGC predicted results (left image) to the dig results.
During review of the intrusive results, the AGC geophysicist noted that only a small piece of frag was recovered at a location where the source was a perfect fit to a 37mm projectile. The dig team was asked to revisit the location and they recovered a 37mm projectile just outside of the 0.4 m dig radius.
A root-cause analysis revealed that the flag was not placed with the precision required to support the 0.4 m intrusive investigation radius. A short-term corrective action required review of all ‘as staked’ intrusive investigation flag locations and re-investigation of any locations found to be placed greater than 15cm from the intended location. The recovered 37mm projectile was determined to be a QA seed. Although this seed was blind to the contractor, it was discovered through the contractor’s QC process.
The lessons learned from this QC failure are as follows:
- Proper chartering of intrusive investigation teams must stress that greater precision is required in the reacquisition of target locations than is typically required for conventional DGM and dig operations.
- Comparison of the ‘as-staked’ flag locations to the dig list locations is a necessary QC step to confirm that the target locations are reacquired with sufficient precision to support the specified project dig radius.
- Comparison of the intrusive results with the predictive model for validation of the AGC process provides the additional benefit of providing an additional QC check on the intrusive results.
- The contractor’s QC seeds should be left in place to provide a QC check of the entire process including intrusive investigation.
Misclassified QC seed. The initial classification results did not identify a QC seed as a TOI. Because all QC seeds must be identified as a TOI, this lapse resulted in a failed MQO that required a root-cause analysis. The root cause analysis revealed that the process of merging closely spaced targets resulted in the seed not being covered by the footprint of the sensor. The targets for cued investigation were selected using the ISS process. This process inverts the anomalous data to find intrinsic (size and wall-thickness) and extrinsic (location) feature estimates of the sources. Sources found to be too small or thin-walled to be possible TOI are removed from the target list. The inversion is run three times assuming one, two and three sources. Closely spaced, possible TOI sources are assumed to be duplicates and are merged into a single location.
The original merge threshold was set to 0.4 m (a value typically used to merge closely spaced sources on conventional DGM surveys). The results for this merge are presented on the left side of Figure 9‑8. The merged location (red circle) was within the MQO of 0.4 m from the seed item, so the seed was judged to be detected. The sensor (shaded square) was positioned within 0.2 m of the merged location (again within the MQO for sensor/target location separation). However, the final distance between the actual seed location and the center of the array was just under 0.6 m and the seed was not properly interrogated by the sensor.
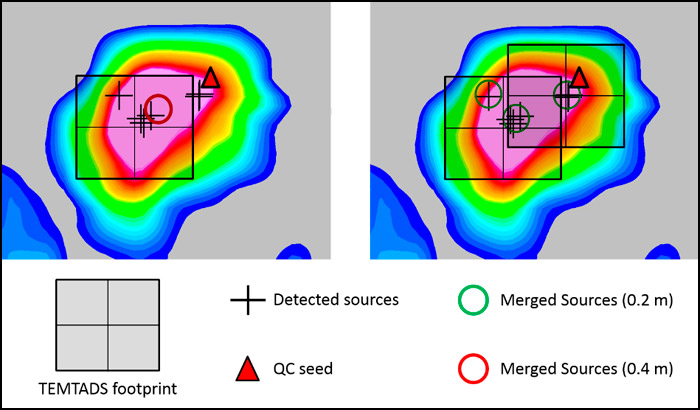
Figure 9‑8. Misclassified QC seed. Left Panel: Using a 0.4m merge radius, the QC Seed (red triangle) did not fall under the TEMTADS 2×2 footprint for the resulting target location (red circle). Right Panel: using a 0.2 m radius a separate target is identified resulting in a TEMTADS 2×2 measurement over top of the seed (and correct classification of the seed).
The corrective action for this case resulted in remerging of the identified sources using only a 0.2 m merge radius. As shown on the right side of Figure 9‑8, this remerging resulted in the identification of two targets for cued investigation with the seed being properly interrogated and classified as a TOI.
Lessons learned from this QC finding are as follows:
- When merging sources derived using ISS, the merge distance should be 0.2 m or less to avoid moving a detected source too far from the original detected position.
- The combined MQOs for (seed) detection and array positioning errors over the targeted location should account for the worst-case scenario where all errors combined result in the seed not being properly interrogated. In this case, because the footprint of the TEMTADS 2×2 is +/- 0.4 m, the combined MQOs for detection and initial interrogation location offset should each be limited to 0.2 m (thus add up to 0.4 m). However, under challenging circumstances (severe slopes or multitarget scenarios) an allowance for a small percentage of results to be outside these metrics must be made. Although this practice theoretically allows for a potential missed TOI, this result must be considered a limitation of the technology to be addressed during the DUA (the results will indicate the severity of the potential problem thus allow assessment of the effect on usability).
QA Seed Positioning Accuracy. After final delivery of the results, the MQO for positioning accuracy for the government emplaced QA seeds was not met. A comparison with the accuracy performance for the contractor emplaced QC seeds (Figure 9‑9) suggested that the problem was the accuracy of the QA seed ground truth. Review of the procedures used to derive the ground truth positions reveals that the seed locations were measured before the seeds were emplaced, thus the measurements were not precise enough to support their use as a quality monitoring tool. This finding resulted in no required corrective action other than documentation as a lesson learned.
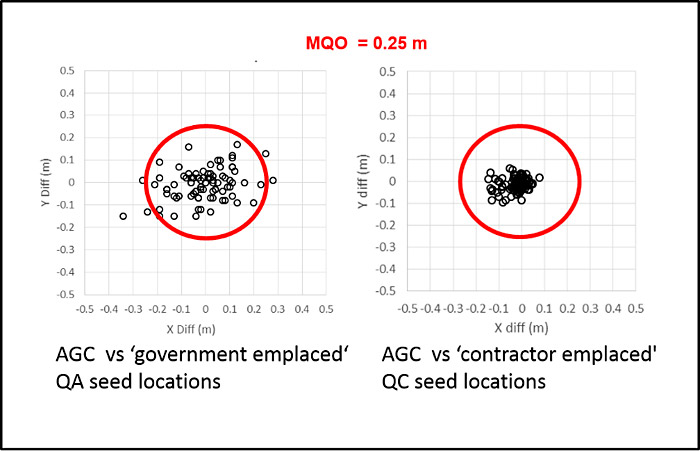
Figure 9‑9. QA vs QC seeds. Positioning performance against government emplaced seeds (left panel) was not consistent with the performance against the contractor emplaced seeds.
The lesson learned from this QC failure is that proper chartering of all personnel involved in emplacing seed must stress that greater precision is required for positioning seeds than is typically required for conventional DGM and dig operations.
9.2 Example Case Study 2: Soil Processing
A construction contractor working in an area formerly owned by the Navy encountered buried debris in subsurface soil during the excavation portion of a construction project. After examination of the debris, suspected munitions items were identified. EOD responded to the site and removed a projectile fuze. After further discussion with the construction contractor, it was determined that additional MPPEH may have been encountered during recent excavation activities at the site. Examinations of photographic material revealed that cartridge cases for 105mm, 90mm, and 5-inch projectiles had been found on the site. These items were currently in the soil stockpiled on the site. This soil contained abundant debris and was discolored.
After reviewing the archives, there was no known history of munitions use in the vicinity, either as a range or training area. There were reports of materials deposited in the area, however, including metal scrap, empty ammunition casings, and aircraft and ship parts. A time critical removal action (TCRA) was initiated at the site to address the soil.
9.2.1 Project Planning and Execution
The objective of this TCRA was to remove existing contaminated soil within the construction footprint, remove any MEC and MPPEH from the excavated soil, and properly dispose of the already excavated soil and debris. Initial estimates of the soil volumes that needed to be addressed included 6,355 cubic yards of excavated soil and 7,500 cubic yards of material that still needed to be excavated.
Geophysical survey techniques were not attempted on the stockpiled soil and soil that still needed to be excavated because of the abundance of buried metallic debris. Instead, heavy equipment was armored to defeat hazardous fragments (as necessary for contingency munitions with the greatest fragmentation distance and separation; distances were strictly enforced to defeat blast overpressure effects). The primary technique used to remove MEC and MPPEH was mechanized excavation followed by mechanical and manual screening operations. Excavated soil was mechanically screened to remove the smallest MEC item with high explosive filler, which was a 20mm projectile. The UXO contractor visually inspected all material that did not pass through the ¾-inch screen deck to ensure that all MEC and MPPEH larger than small arms ammunition (SAA) was removed. Once the excavated material was cleared of explosive hazards, it was analyzed for pollutants and contaminants and managed in accordance with applicable state and federal regulations.
The UXO contractor used excavators, backhoes, bulldozers, and front-end loaders that provided the minimum separation distance required for the munition with the greatest fragmentation distance (MGFD) to conduct all excavation activities. The mechanical screening operations involved the use of (1) front-end loaders and excavators for loading and transporting soil/debris; and (2) a mobile mechanical screen. A UXO Technician II (or III) performed visual monitoring of the screening operation from the approved (K24) distance from the closest discharge of material that could potentially contain MEC. When MEC or MPPEH was identified during the screening operations, the UXO contractor temporarily halted the screening operations using a remote or emergency stop switch and performed MEC and MPPEH inspection and handling in accordance with the ESS. The UXO contractor resumed screening operations following safe removal or disposal of the identified MEC or MPPEH. Oversized materials (over ¾-inch) were spread out (no deeper than 8 inches) in an adjacent area and visually searched with the aid of handheld detectors to ensure no MEC or MPPEH was present. Figure 9‑10 shows the screening plant in operation. Figure 9‑11 shows the screened material spread out for inspection.
Once the excavated soil had been processed through the mechanical screening operation defined above, the final screened soil and oversize rocks and debris were transported by a loader and dump truck to an open adjacent area for stockpiling. Each stockpile of screened material was managed in small stockpiles and assigned a unique identifier, or lot number, for tracking purposes. After the screened piles had been QC/QA inspected, the piles were consolidated and labeled or otherwise demarcated as passed QC/QA (such as signage or tape).
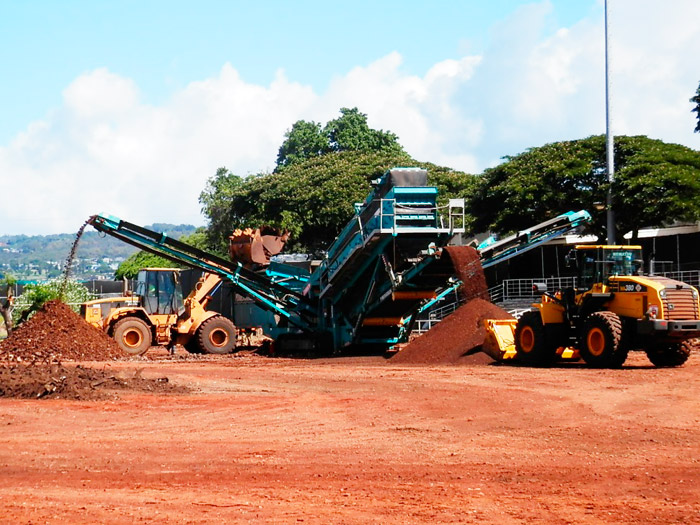
Figure 9‑10. Official US Navy photo. Screening plant with screened material greater than ¾ inch on the left and less than ¾ inch on the right.
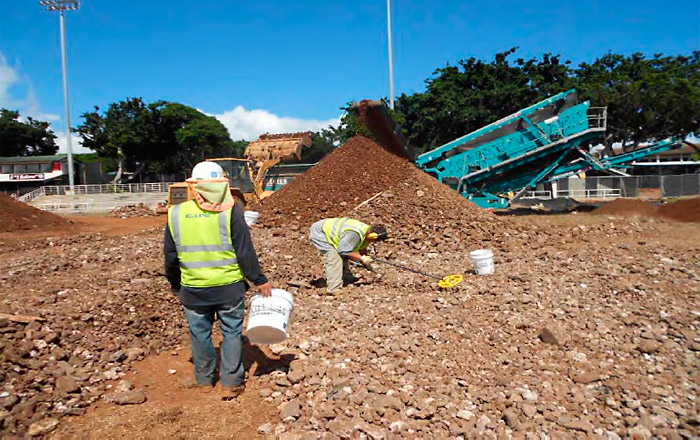
Figure 9‑11. Official US Navy photo. Sweeping 3/4 inch + spoils with a Whites all metals detector.
9.2.2 QC Requirements/Reporting
A DFW task is separate and distinct from all other tasks and has a specific set of control requirements. To execute the TCRA, the following DFWs were performed for this removal effort:
- Mobilization and site preparation.
- Detection instrument validation.
- Manual MEC and MPPEH removal.
- Mechanical soil screening.
- MPPEH processing.
- Excavation, loading, hauling.
- Sampling.
- Waste transportation and disposal.
- Site restoration and demobilization.
The Three Phase Control System was used to help control quality on this project. Specific QC activities were defined for each DFW. Some examples of the QC tasks are shown in Table 9‑1.
Table 9‑1. Example soil processing QC tasks
| DFW: Mechanical Soil Screening | ||
|---|---|---|
| QC Task | Inspection | Acceptance Criteria |
| Review Plans and Specifications |
|
|
| Stockpile Management |
|
|
| Equipment and Materials |
|
|
| DFW: Detection Instrument Validation | ||
| Appropriate equipment and materials are in place and are operating correctly. |
|
|
| DFW: Manual MEC and/or MPPEH Removal | ||
| MEC and/or MPPEH Removal | Verify that:
|
|
The three-phases of control (preparatory, initial, and follow-up) were the core of the Construction Quality Management System, which the contractor used to ensure that construction, including that of subcontractors and suppliers, complied with the requirements of the contract. Three-phase control system inspections were conducted by the UXOQCS or SSHO/QCO or both for each DFW of the construction work as per the specifications.
Each control phase provides an opportunity to prevent deficiencies that could result in nonconformance. Implementation of the three-phased QC process is the responsibility of the PDT. Surveillance during the execution of these activities was documented on the appropriate forms. For each task assignment, specific charts and checklists were prepared to assist the UXOQCS and SSHO/QCO in ensuring that the work elements were properly performed.
For the mechanical soil screening, small ISOs were placed in the soil being introduced to the mechanical screener at a minimum frequency of one ISO per 250 cubic yards of soil. The minimum performance standard was the recovery of all QC blind seeds. Failure to locate a blind seed item would result in the UXOQCS failing that portion of the grid or work area and the UXO team would resweep or rescreen the work grid or lot.
Initially, 25% of all screened soil was required to pass through a QC inspection. After four QC lots successfully passed inspection, the quantity inspected was reduced to 10%. Any subsequent QC inspection failures would trigger a return to a 25% inspection until four succeeding lots successfully passed the QC inspection. Upon completion of the QC inspection process, the UXOQCS would sign off on a statement for each QC Lot indicating the following:
“QC Lot _______ has been processed in accordance with the procedures outlined in this ESS, which were developed to ensure the removal of all MEC and/or MPPEH 20mm in diameter in the smallest dimension. This material is thereby, within a reasonable degree of certainty, documented to be free of MEC and/or MPPEH 20mm in diameter in the smallest dimension and approved, contingent upon the independent QA inspection, for transportation offsite and disposal.
______________________
QC Inspector Name______________________
QC Inspector Signature______________________
Date”
9.2.3 QA Requirements/Reporting
On this project, a third-party QA contractor was hired by the Navy to perform QA on the project. The third-party QA contractor developed a Quality Assessment Surveillance Plan which outlined methods and procedures for performing QA on the project including:
- periodic direct visual surveillance of MR operations
- periodic assessment and documentation of methods, procedures, and results of the MR operations
- regular meetings with the Contractor’s project team to review the MR assessment results and overall progress
The NOSSA MR self-assessment checklists were used to document the assessment results, including any deficiencies, in accordance with the SOPs and QC program.
A project specific QA requirement was that the identification of MEC and MPPEH larger than SAA in screened soil or the failure to recover all seed items from a grid were used to constitute QA audit failure. Either instance would have required rework of the failed grid or screened material lot.
Another requirement was that 10% of all material that has passed the QC process pass through a QA inspection. Upon completion, the QA inspector would sign off on a statement indicating the following:
“A 10 percent QA inspection was performed on QC Lot ________ to confirm that the procedures outlined in the ESS were adequate to remove all MEC and/or MPPEH 20mm in diameter in the smallest dimension and that the QC process confirmed the adequacy of the procedure. QA of this QC Lot is intended to be representative of QC Lots _________. QC Lot ________ has successfully passed the QA inspection. Therefore, the material in QC Lots__________ is (are), within a reasonable degree of certainty, documented to be free of MEC and/or MPPEH 20mm in diameter in the smallest dimension and approved for transportation offsite and disposal.
______________________
QC Inspector Name______________________
QC Inspector Signature______________________
Date”
An example of some of the questions used to assess the UXO contractor from the NOSSA MR self-assessment checklist are provided in Table 9‑2.
Table 9‑2. Example QA/QC checklist questions
| Description | Yes | No | N/A |
|---|---|---|---|
| Does the UXO contractor have a QC program and is a UXOQCS assigned? | |||
| Is the UXOQCS not supervised by the senior UXO supervisor? | |||
| Is the QA program administered by an independent, third-party activity? | |||
| Is there a QAPP? | |||
| Does the QAPP cover the entire scope of the MR project? | |||
| Are the Project Quality Objectives being implemented in accordance with the QAPP? | |||
| Does the QAPP identify a mechanism, (for example, a nonconformance report or deficiency notice) that formally documents nonconformance and requires root cause analyses, corrective actions, and approved departures? | |||
| Does the QAPP identify the pass/fail criteria for each task and the corrective action processes which will be employed should the UXOQCS identify a failure? | |||
| Does the UXOQCS issue daily QC reports and are the reported facts consistent with other contractor production reports? | |||
| Has the UXO contractor implemented the three phases of quality (preparatory, initial, and follow-up) and is the UXOQCS inspecting each definable feature of work by phase? | |||
| Has the UXO contractor implemented the GSV process and has the UXOQCS installed an IVS and emplaced blind seeds? |
9.2.4 Project Results/QA/QC Successes
After processing the soil through the soil screening operations, over 800 munitions related items were identified. Each of these was assessed and all of them were determined to be material documented as safe (MDAS). Figure 9‑12 shows one of the munitions related items, a 40mm cartridge base. Figure 9‑13 shows some of the miscellaneous metal debris recovered at the site.
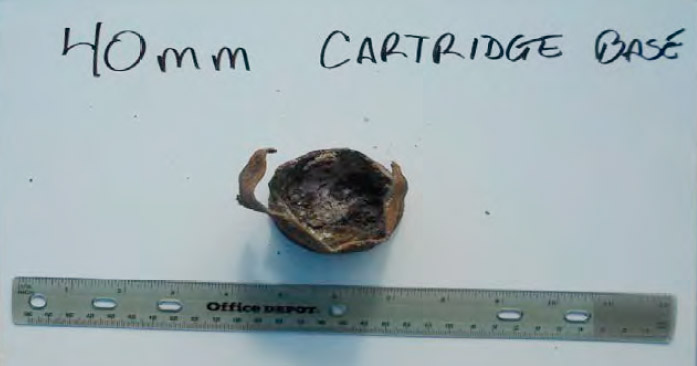
Figure 9‑12. Official US Navy photo. 40mm Cartridge Base recovered from 3/4 inch + spoils.
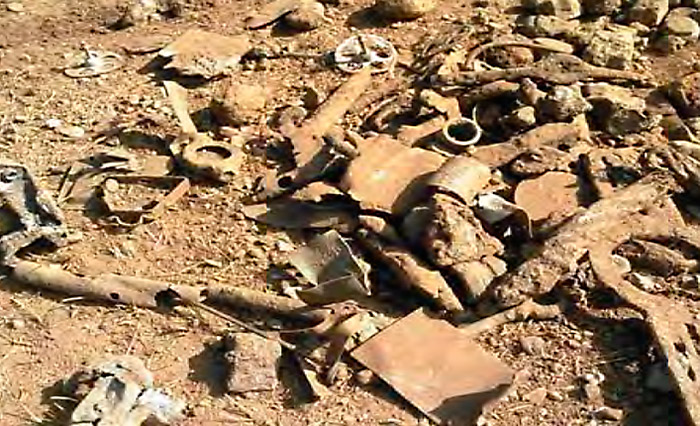
Figure 9‑13. Official US Navy photo. Miscellaneous metallic debris recovered from 3/4 inch + spoils.
The third-party QA contractor determined that no quality discrepancies were observed during the project and that the work was performed in accordance with project plans, the ESS, and applicable regulations.
9.2.5 Process Improvements
The work at this site was completed prior to ESTCP’s GSV document that includes a surrogate for a 20mm projectile. This surrogate is smaller than the one used for this project and would be a more difficult QC check of the soil processing operations.
Since the implementation of this project, the Navy has also developed a Quality Assessment Spreadsheet that includes additional questions to assess a UXO Contractor. These additional questions should be used in the future to assess a UXO Contractor (NAVFAC 2017).


